Reports overview
How to open MonsoonOS Reports, choose the period and location, move between report tabs and export the period to Excel, and what Rain Pay Terminals Only reports include.
- Plans
- Available on every MonsoonOS plan: Full Wash Platform and Rain Pay Terminals Only.
- Who can do this:
- On Full Wash, anyone whose role includes "See wash reports" (Owner and Manager by default). On Terminals Only, your admin login.
Reports show what your wash collected over a period: totals, trends, every transaction and how your bays are used. This page covers how the reports work. Report tabs explains what each tab shows.
Open Reports
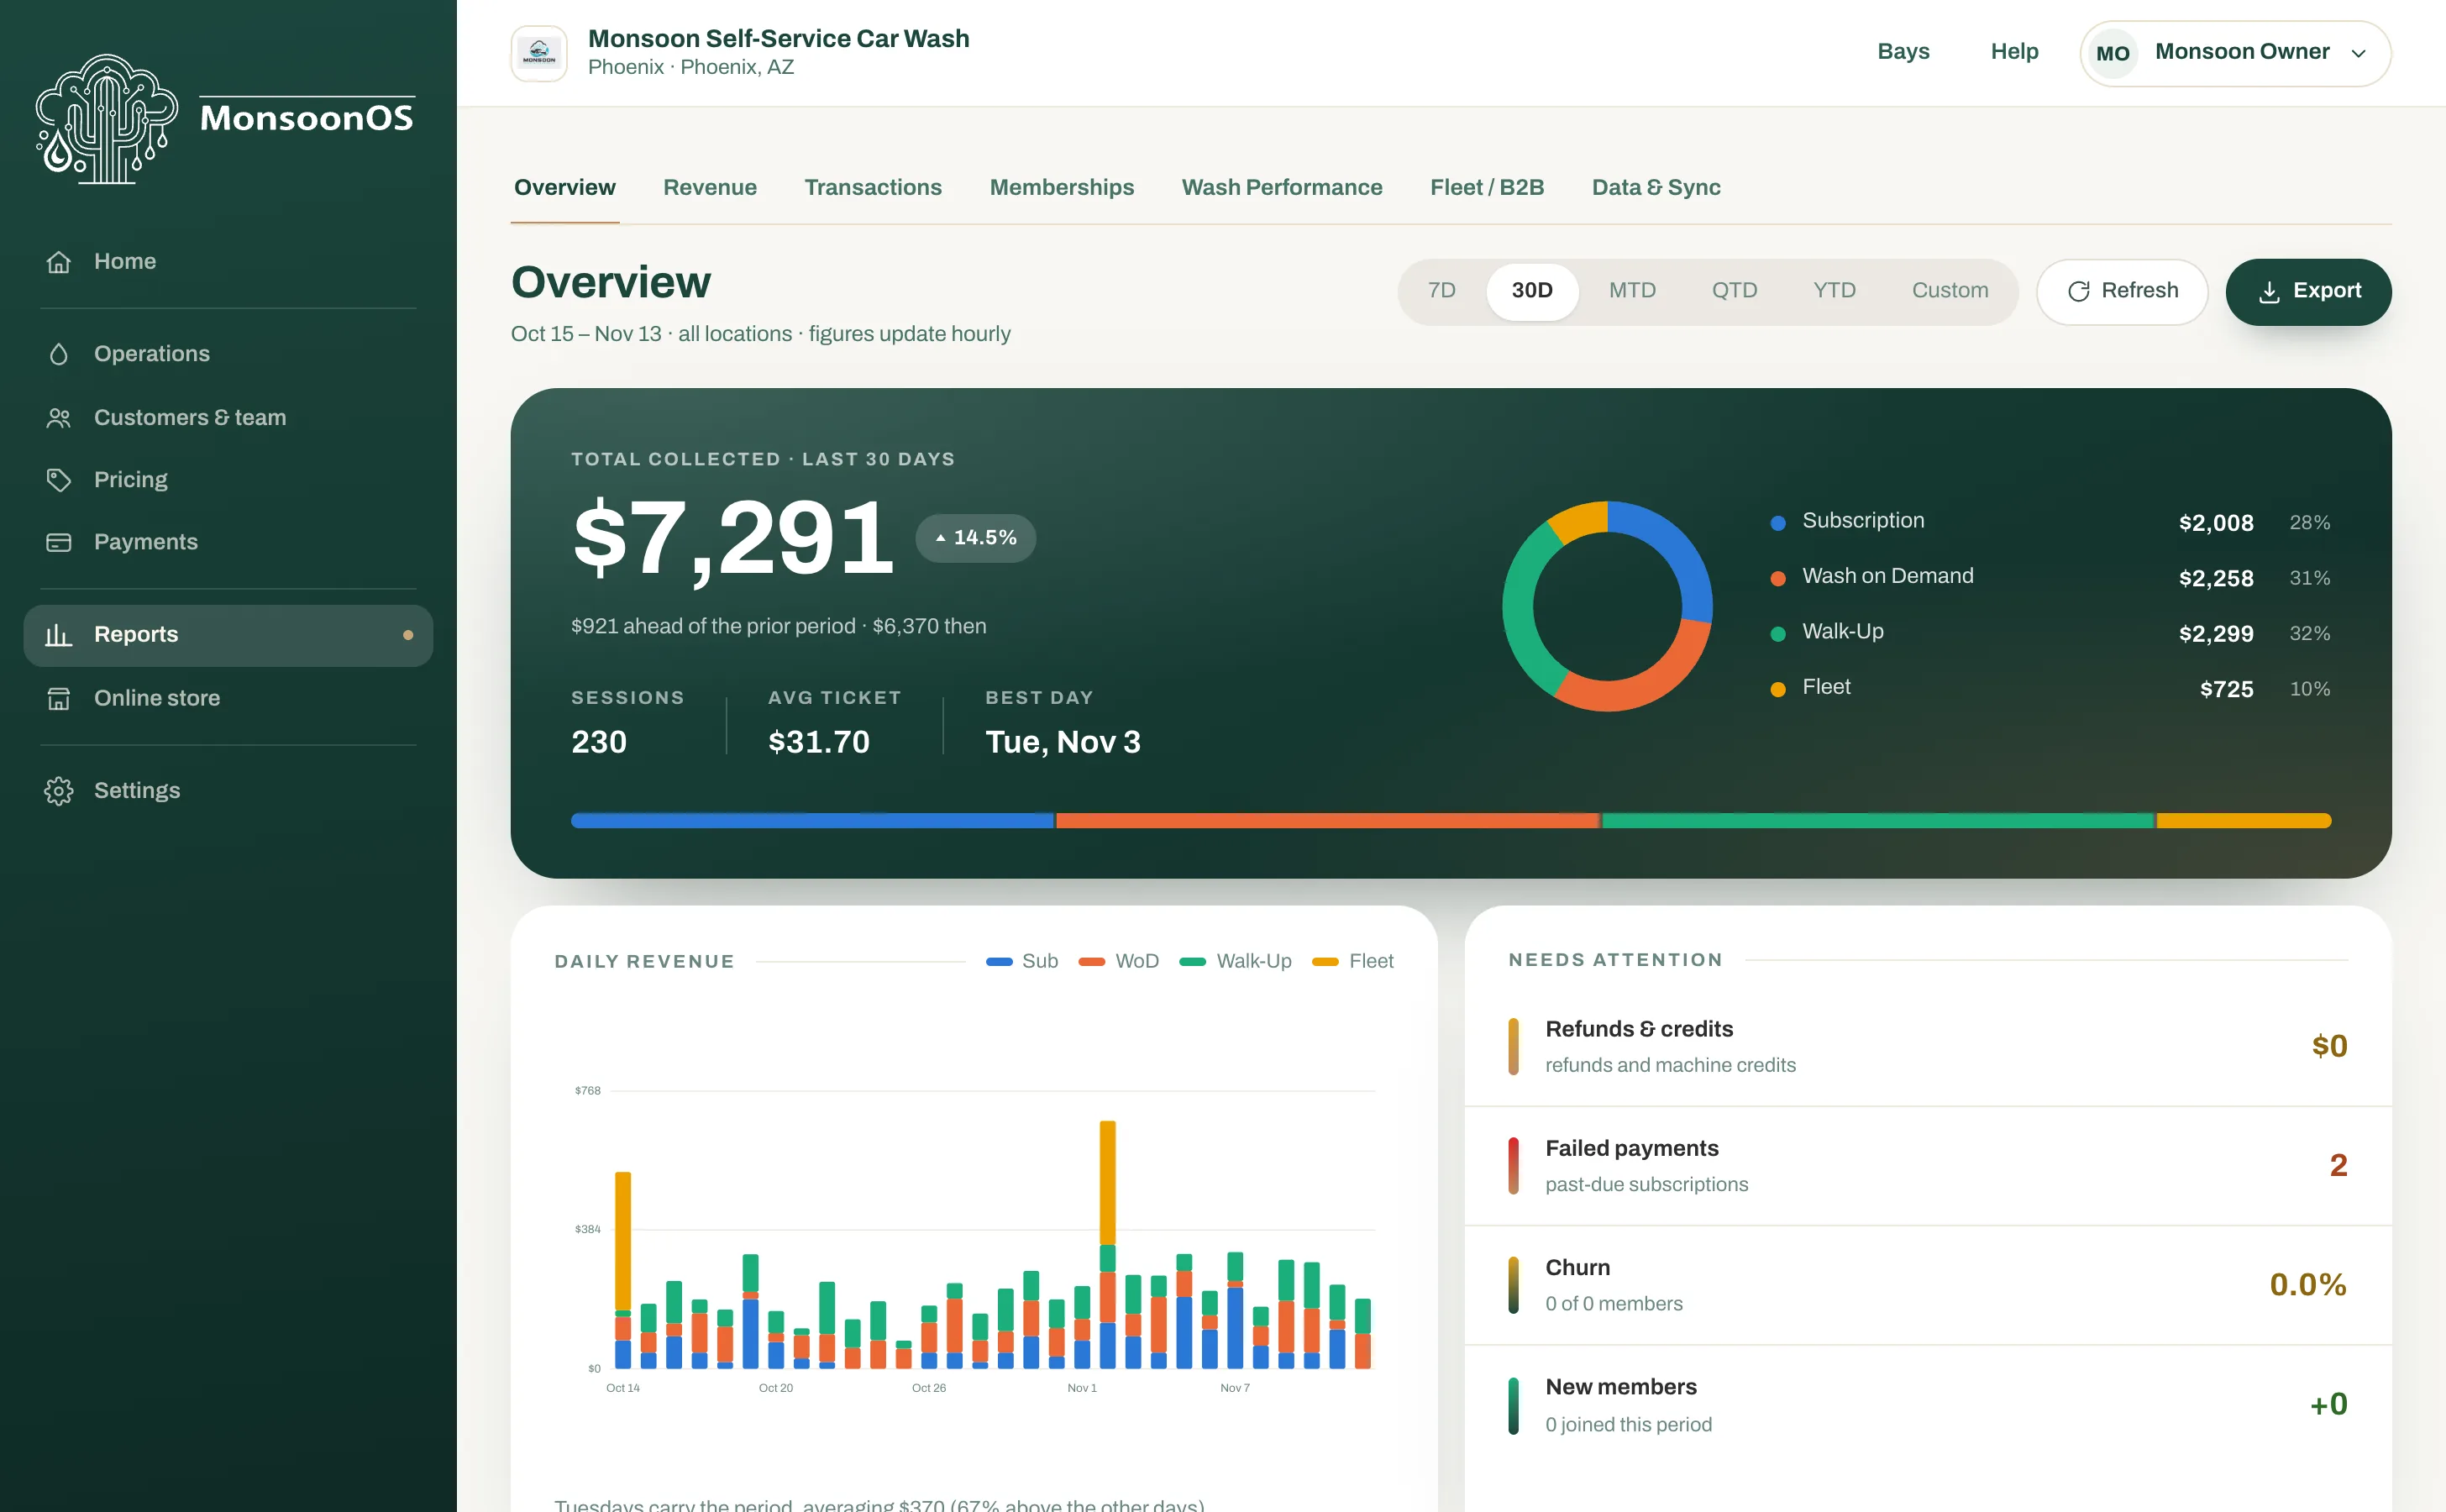
Go to Reports. The Overview tab opens first, for the last 30 days.
With several locations, Reports covers the whole business. To see one location, choose it from the location list at the top of the report.
Find your way around
- The tabs run across the top: Overview, Revenue, Transactions, Memberships, Wash Performance and Fleet / B2B. Memberships shows on the Full Wash Platform and Fleet / B2B with Fleet. After them, Vending opens Dryline VMS reports in a new tab for businesses with Dryline VMS, and Data & Sync holds report tools for roles that include Run forecasts.
- The admin menu stays on the left, so you can leave Reports for any other area.
- The heading names the tab. The line under it shows the dates, the location, and that figures update hourly.
- Refresh reloads the figures on the page.
The period and location you choose stay the same as you move between tabs.
Choose the period
Select one of the period buttons at the top:
| Button | Period |
|---|---|
| 7D | The last 7 days, today included |
| 30D | The last 30 days, today included (the default) |
| MTD | This month so far |
| QTD | This quarter so far |
| YTD | This year so far |
| Custom | Two dates you pick: a start and an end |
Each day runs from midnight to midnight in your location's time zone. Totals compare against the same length of time just before, so you can see whether you are ahead or behind.
Choose a location
With more than one location, the Overview tab has a location menu above the totals: choose a location, or All locations. The Transactions tab has its own location menu.
If your role is limited to certain locations, every report shows only those locations. See Limit someone to certain locations.
Export to Excel
- Choose the period and location you want.
- Select Export.
- Select Excel (this period).
You get a workbook with a Summary sheet (the period's totals by stream) and a Transactions sheet (every sale in the period). With Fleet, an export of all locations also has a Fleet Invoices sheet. Dates in the file are your local dates.
To save one receipt, member statement or fleet invoice as a PDF, open it from its tab and select PDF. Print prints it.
What each plan's reports include
| Full Wash Platform | Rain Pay Terminals Only | |
|---|---|---|
| Terminal and pay station sales (Walk-Up) | Yes | Yes |
| Wash Club memberships (Subscription) | Yes | No |
| Washes paid in the app (Wash on Demand) | Yes | No |
| Fleet invoices (Fleet) | Yes | With the Fleet add-on |
On Terminals Only, your totals are your terminal sales. Terminals Only does not include Wash Club or the customer app, so Reports leaves out the Memberships tab, the Subscription and Wash on Demand streams and the membership figures. Sales from MDB card readers count as walk-up sales too: see How MDB sales show up.
Next
Report tabs walks through what each tab shows.